Recent posts

Money Talks
The Intricacies of Trading Crypto vs. Forex
03 April 2024

Industry Experts
5 Effective Ways to Drive Traffic to Your Website
19 March 2024

Fur, Fins & Feathers
How To Maintain Your Dog’s Oral Hygiene At Home
14 March 2024
nichemarket Advice
Demystifying TikTok Metrics for Brands (Especially Small Businesses)
13 March 2024
Popular posts
Extravaganza
Trending Music Hashtags To Get Your Posts Noticed
24 August 2018
Geek Chic
How To Fix iPhone/iPad Only Charging In Certain Positions
05 July 2020
Extravaganza
Trending Wedding Hashtags To Get Your Posts Noticed
18 September 2018
Money Talks
How To Find Coupons & Vouchers Online In South Africa
28 March 2019
Real Time Data Dashboard With GA and Data Studios
23 March 2017 | 0 comments | Posted by Che Kohler in nichemarket Advice
The release of Google Data Studio for free in South Africa has opened up a range of data presentation possibilities for local businesses. Data Studio will help marketers and agencies create stunning reports suited to clients and stakeholder requirements, reduce reporting turnaround times and most importantly reduce reporting discrepancies. No longer do we have to extract data into spreadsheet or Google sheets and manually set up dashboards. We can say goodbye to using formulas and arrays, Vlookups and pivot tables that take up way too much time and way too much RAM, my poor excel has crashed many times putting together monthly reports.
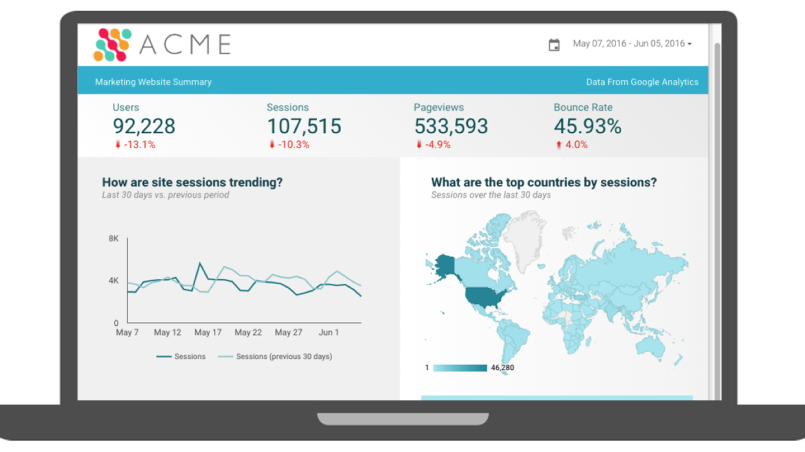
Seeing your site perform in real-time
While there’s so much that I can write about Data Studio I'd like to focus how to leverage real-time reporting to create dashboards you can send to clients or display around the office for all to see. Google Analytics offers real-time data in its native dashboard however it's pretty static and can't be customised. While this is adequate for some, who among us would say no to setting up a fancy branded dashboard, I know I can't.
Access to real-time reporting
Be forewarned this will require some effort on your part to set up so read carefully going into this next bit. The reason is that even though Data Studio has so many great data connectors including Google Analytics, we have not been privileged enough to be able to connect to the Real-Time Google Analytics API. But that doesn't mean there isn't a solution for it to work. So let us get to it, shall we?
This workaround requires the following:
- Using the super proxy to fetch data from the Google Analytics Real-Time API
- Presenting the data in Google Sheets (which has a connection to the Data Studio)
- Adding a trigger to our Sheets, so that it will be refreshed automatically
- Connecting our Sheets to the Data Studio for Google Analytics Real-Time data (latency of 1 minute)
How to set up real-time reporting
Step 1: Setting up a Google Analytics superProxy
- Visit the Google Cloud Platform App Engine and log in with your Gmail
- Download the SuperProxy application from
git hub - Register an application ID for your application using the App Engine Administration Console. This will give you a free hostname on appspot.com.
- Edit the app.yaml file in the src directory of the Google Analytics superProxy and set the first line to the application ID you registered in the previous step. E.g. application: your-application-id.
Edit or create a new APIs Console Project and add the full URL of your application + /admin/auth as an Authorized Redirect URI for the OAuth 2.0 Client. If using the free appspot.com domain, the redirect URI will look something like https://your-applciation-id.appspot.com/admin/auth.- Edit config.py in the Google Analytics superProxy src directory and update OAUTH_CLIENT_ID, OAUTH_CLIENT_SECRET, and OAUTH_REDIRECT_URI if necessary.
- Using the Google App Engine Launcher or appcfg.py deploy the application. For details see Uploading Your Application.
- View the app by visiting the /admin page of your application. E.g. https://your-application-id.appspot.com/admin.
For more on what the Google Analytics SuperProxy can do check out the developers guide here
Step 2: Setting up a Google Analytics query
Now that the superProxy is running you will need to create a query to enter and it’s refresh interval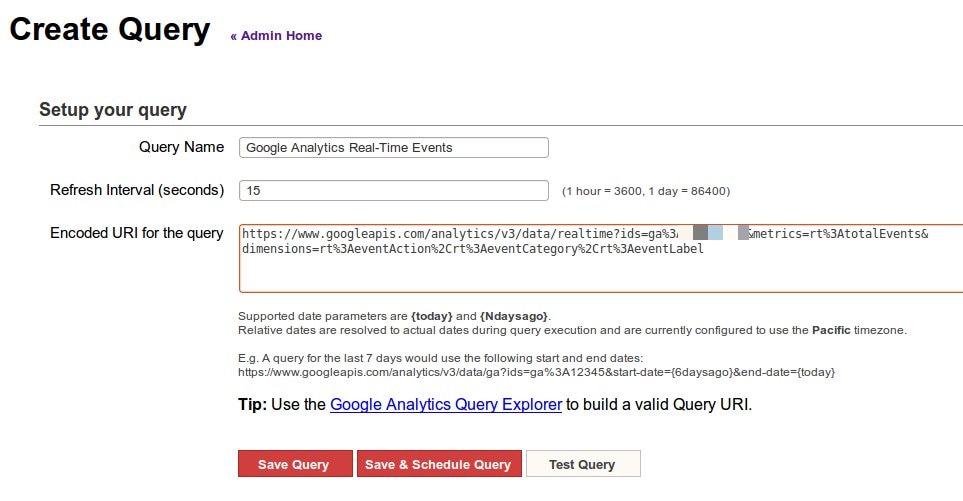
This query is all events by event Category Action and Label. You can easily modify it with the Google Analytics Real-Time API explorer After we save our query we will reach this page:
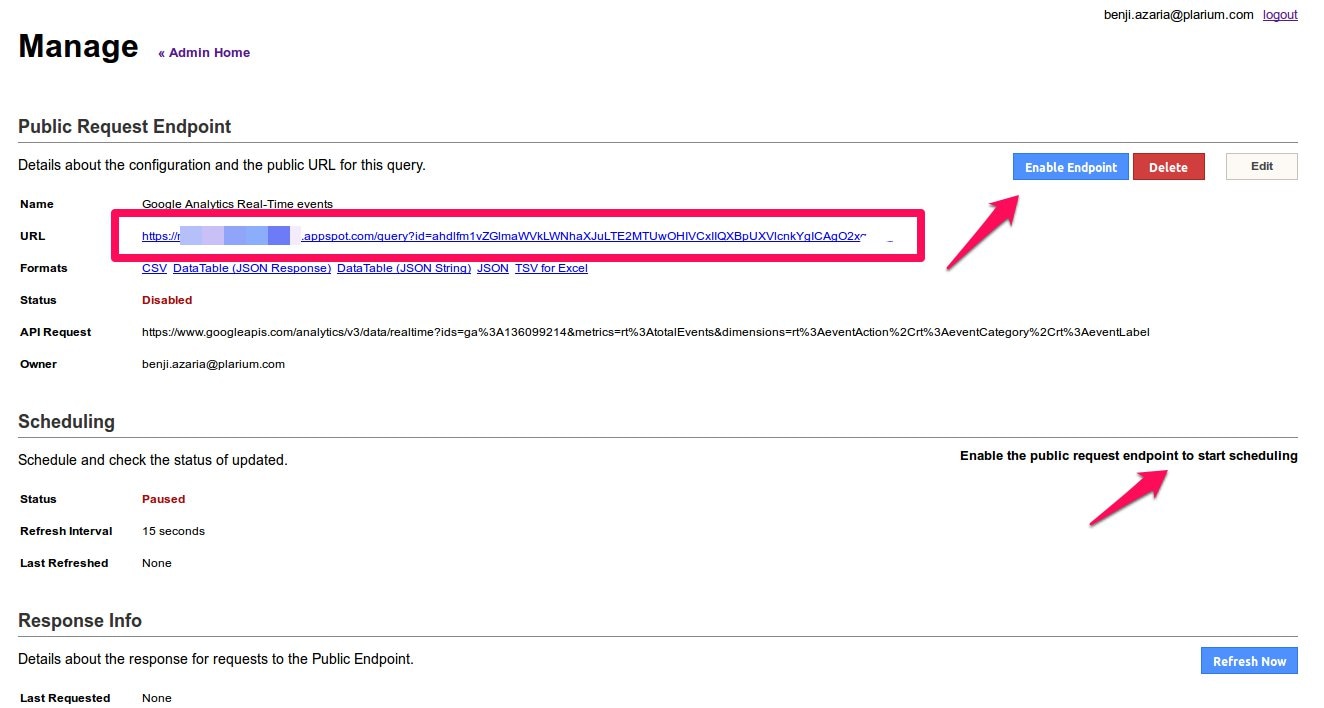
We will enable our endpoint and then Start Scheduling.
Let’s copy the URL, we’ll use it real soon
For more on what the Google Analytics SuperProxy can do check out the API explorer here
Step 3: Extracting the data query
Now let’s open a new Google Sheets file, under Tools, we choose Script editor then replace the default function with this one:
function refreshSheet(){
var ss = SpreadsheetApp.getActiveSpreadsheet();
var sheet = ss.getSheets()[0] // This is the sheetID 0 is the first sheet, 1 is the second sheet etc
sheet.getRange('A1').setValue('1') // We add this so that the cell will be refreshed and not rely on cache
sheet.getRange('A1').setValue('=importdata("[Place here the URL you copied]&format=csv")')
}
Now let’s run this function automatically every 1 minute (or any other timeframe) Click on the Current project’s trigger icon (or Under edit, select the Current project’s trigger) Now we choose the function we would like to run (refreshSheet), then we choose that the event will be triggered - Time-driven (not from spreadsheet), at last, choose how frequent you would like it to reload. The most frequent is every 1 minute
Step 4: Creating your dashboard
Now on to the final step. All you need to do is log in to your data studios account, create a new dashboard and use your Google Sheet created in the previous step as your data source.
That’s it, you now have a pretty nifty dashboard to show off your site's performance around the office for all to see. So feel free to customise to your heart's content with the help of Data Studio (in almost real-time)
Dashboards for the office
Have you built any dashboards in data studio using real-time data? Let us know in the comments section below
Contact us
If you want to know more about data studio dashboards don’t be shy we’re happy to assist. Simply contact us here Source: optimizingaudience.com
You might also like
Demystifying TikTok Metrics for Brands (Especially Small Businesses)
13 March 2024
Posted by Che Kohler in nichemarket Advice
A guide to TikTok Metrics and some much-needed context behind them so brands and businesses do not end up overpaying for top-of-funnel vanity metrics...
Read more
What Is GEO (Generative Engine Optimization)?
01 March 2024
Posted by Che Kohler in nichemarket Advice
An introduction to generative engine optimisation, how it works and how it could be part of future SEO strategies as a way to generate traffic and co...
Read more{{comment.sUserName}}
{{comment.iDayLastEdit}} day ago
{{comment.iDayLastEdit}} days ago