Recent posts

Beauty Basics
Tretinoin Cream 0.025% vs 0.05% vs 0.1% South Africa Guide
15 May 2026

Shopaholics
Protection Strategies That Work For Shipping Fragile Items
12 May 2026

Alarming
How Retail Theft Affects Florida-Based Businesses
01 May 2026

Fur, Fins & Feathers
How To Choose The Ideal Dog Food
28 April 2026
Popular posts
Extravaganza
Trending Music Hashtags To Get Your Posts Noticed
24 August 2018
Geek Chic
How To Fix iPhone/iPad Only Charging In Certain Positions
05 July 2020
Extravaganza
Trending Wedding Hashtags To Get Your Posts Noticed
18 September 2018
Money Talks
How To Find Coupons & Vouchers Online In South Africa
28 March 2019
Google Analytics Launches Conversion Probability Reports
23 April 2018 | 0 comments | Posted by Che Kohler in nichemarket Advice
Google Analytics has become one of the most valuable website tools available to webmasters and digital marketers of late and we've become reliant on it to not only monitor site performance and marketing spend but also as a basis for businesses decision making.
Over the past few years, Google has continued to improve its analytics platform in order to help us understand online user behaviour and get the most out of the traffic we attract each day.
The latest addition to Google Analytics is their Conversion Probability report which will be eligible customers both free and paid (on the Google Analytics 360 platform).
What is a Conversion probability Report?
The new conversion probability report allows you to understand the likelihood of when a user is most likely to convert. The conversion probability calculation is based on a machine learning model that learns from users who have made transactions in the past and then applies these multiple signals to all users visiting your site.
You can then use this metric to segment and create audience lists and reach out to them using AdWords and DoubleClick or provide personalized experience via Google Optimize. Which will, in turn, help you drive higher conversion rates at a lower CPA.
About Conversion Probability
Using the same data modelling techniques that determine Smart Lists and Smart Goals, Analytics calculates the % Conversion Probability dimension and the Average Conversion Probability metric to determine a user’s likelihood to convert during the next 30 days.
Transactions for each user are evaluated, and the resulting probability of conversion is expressed as an average score of 1-100 for all users during the date range, with 1 being the least probable and 100 being the most probable. A value of 0 indicates that conversion probability is not calculated for the selected time range. % Conversion Probability is calculated for individual users.
Average Conversion Probability is calculated for all users related to a dimension for the date range you’re using, for example:
- The score for all users where Channel = Organic Search January 1 - January 31
- The score for all users where Source = Google during January 1 - January 31
The % Conversion Probability dimension, with ranges as dimension values, is available in the Conversion Probability report, and in Analytics segments, remarketing audiences, and custom reports. The Avg. Conversion Probability metric is available in custom reports.
Prerequisites
In order to calculate the dimension and metric, Analytics needs the following:
- A minimum of 1000 e-commerce transactions per month in the reporting view. (You must have implemented Ecommerce Tracking).
- Once you reach the initial threshold of 1000 e-commerce transactions, Analytics then needs 30 days of data to
model .
If the number of transactions in the reporting view falls below 1000 per month, then Analytics uses the last good model to generate data for the report.
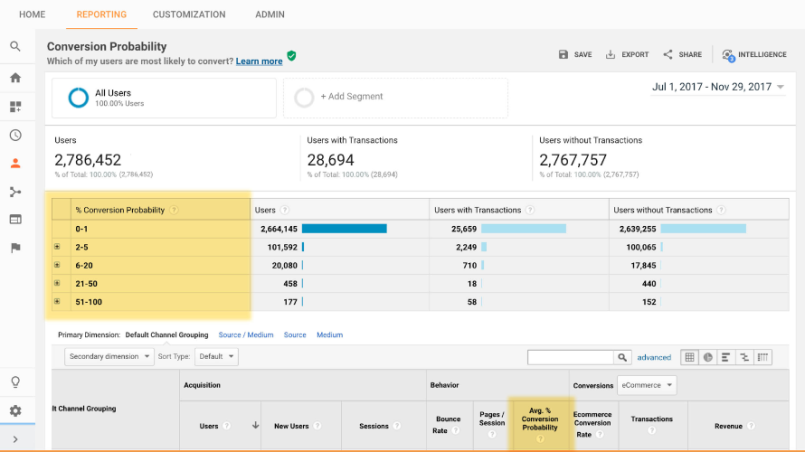
The Conversion Probability report
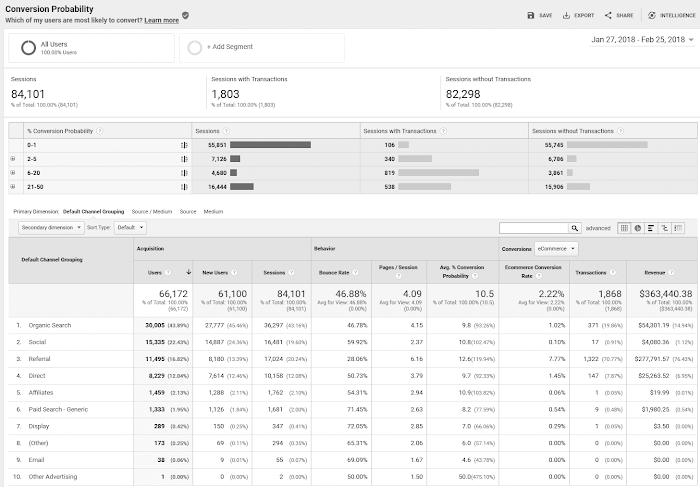
The Conversion Probability report lets you see:
- The distribution of sessions, and sessions with and without transactions, across conversion-probability buckets (histogram) (for example, the number of sessions where user values for % Conversion Probability ranged from 21-50)
- Acquisition, behaviour, and conversion metrics for users across the dimensions of Default Channel Grouping, Source, and Medium (table)
Using conversion-probability data
So how can you put this newly found conversion probability data to good use?
Segments
With segments, you can look at any of your data in the context of conversion-probability thresholds. For example, you can create a segment for % Conversion Probability andgt; 25, and then examine things like:
- How your users who demonstrate a strong likelihood to convert compare with your overall user base. Do they represent a small fraction of your users, or do your advertising and site combine to engage a large percentage of your users?
- Which channels, keywords, and campaigns deliver highly engaged users.
- Which conversion paths are most effective, and where along the path can you deliver the most effective advertising.
Conversely, you can use a low threshold to examine the opposite end of the user spectrum:
- What percentage of your users are less likely to convert?
- Are the keywords and campaigns that draw users who are unlikely to convert differently from the ones that draw more valuable users? If they are, does it make sense to devote less budget to them?
- Which conversion paths do the lower-scoring users follow? Are there opportunities along those paths to deliver more effective marketing?
Remarketing audiences
Users who are on the threshold of converting are more easily convinced to complete those conversions. For example, users who have studied product details or added items to their carts have given strong signals that they’re already taking ownership of those products. A persuasive follow-up from you via a well-crafted remarketing campaign can provide that last nudge they need to complete the process.
Creating remarketing audiences based on your users who are more likely to convert and publishing those audiences to your various marketing platforms like AdWords and DoubleClick Bid Manager lets you re-engage them everywhere you have an online presence. You can also publish these audiences to Google Optimize so that you can understand exactly which refinements to your site content deliver the highest likelihood of conversion.
Where to Conversion Probability data
To open the Conversion Probability report:
- Sign in to Google Analytics.
- Navigate to your view.
- Open Reports.
- Select Audience > Behavior > Conversion Probability.
Conversion Probability data is delayed by 24 hours: this report depends on the complete processing of the daily-aggregate tables.
Note: If a reporting view does not meet the prerequisites for data, then the report is not visible in Analytics. Also, Conversion Probability is currently based only on transaction data so for those using goals for lead generation, this report won't be applicable to you, for now.
Probability equals new possibilities
While this iteration of the report may be limited in its reach and functionality I definitely feel it is only the beginning and this sort of data modelling will evolve over time to become one of the most important reports in analytics.
Contact us
If you want to know more about tracking options and Google Analytics for your site don’t be shy we’re happy to assist. Simply contact us
Tags: conversion optimisation, Data Analysis, google analytics
You might also like
How Retail Theft Affects Florida-Based Businesses
01 May 2026
Posted by Che Kohler in Alarming
A look into how much retail theft costs stores across Florida, what the down stream impacts are and what you can do to reduce your risk as a shop own...
Read more
10 Best SEO Agencies & Services to Grow Your Business in 2026
10 April 2026
Posted by Lyon Degrasse in Industry Experts
If you are in need of an SEO partner to help you rank in search engines and appear in popular LLMs these agencies have a proven track record of succe...
Read more{{comment.sUserName}}
{{comment.iDayLastEdit}} day ago
{{comment.iDayLastEdit}} days ago