Recent posts

Talent Agents
In-House Vs Outsourcing: What's the Right Fit for Your Business?
08 July 2026

Geek Chic
How Server Room Cooling Affects Uptime
06 July 2026

Alarming
Tax Scams Targeting South Africans
05 July 2026

nichemarket Advice
How Corporate Gifting Can Improve Customer Retention
03 July 2026
Popular posts
Extravaganza
Trending Music Hashtags To Get Your Posts Noticed
24 August 2018
Geek Chic
How To Fix iPhone/iPad Only Charging In Certain Positions
05 July 2020
Extravaganza
Trending Wedding Hashtags To Get Your Posts Noticed
18 September 2018
Money Talks
How To Find Coupons & Vouchers Online In South Africa
28 March 2019
How To Access Content Grouping Reports In GA
29 March 2017 | 0 comments | Posted by Che Kohler in nichemarket Advice

Whether you're a novice or a digital expert, we all like to analyse the performance of our site content. Is what I put online good enough? Is it attracting the people I want? Is it better than my competitor's offering? Sometimes even it's subconscious, like when we check the number of tweets we get from a new blog post. Other times, we make more conscious efforts, like reviewing performance metrics in Google Analytics.
As your site grows it won't be that easy to analyse your site at such a granular level and you will need to break it down into logical pieces you can analyse in isolation. This is where content grouping reports can make all the difference. By automatically grouping your content and its performance metrics into logical pieces that you have predefined, literally, takes half the work out of reporting.
If you want to set up your Google Analytics to capture content groupings, check out our article How To Set Up Content Grouping In GA
So how do you find content grouping reports in Google Analytics? Here are 5 ways!
Content Grouping reports
There are different ways to reach reports in Google Analytics that will make use of your content groupings, each has their own data sets and metrics to explore.
1. All Pages
The All Pages report is a good place to start if you want to see which pages are popular on your website. To find this report:
- Step 1: Navigate to Behavior >> Site Content >> All Pages.
- Step 2: Select your Content Grouping.
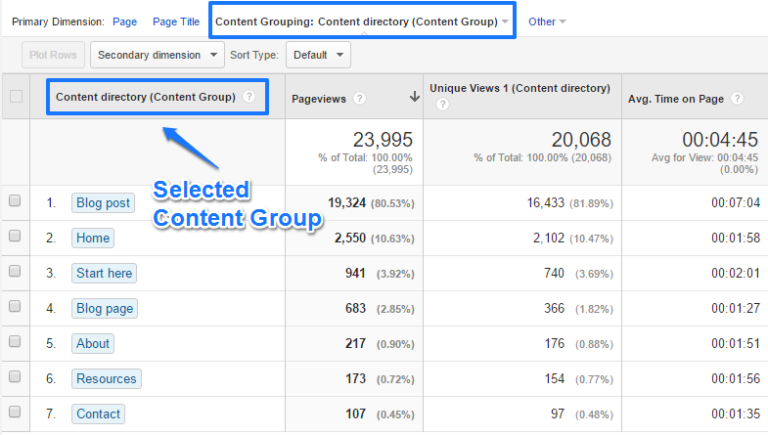
Now you have a more aggregated view on your content performance. In this case, 80% of the pageviews are on blog posts. People spend by far the most time in this section of the website. Normally you would have to drill down or search to find more information on your other content subsets since they have a relatively low volume of traffic. Now you'll have an easy way to put things in perspective.
2. Landing Pages
Another great report where you can examine your content performance is the Landing Pages report. In my opinion, this report will be to those handling content, advertising or UX. To find this report:
- Step 1: Navigate to Behavior >> Site Content >> Landing Pages.
- Step 2: Select your Landing Content Group.
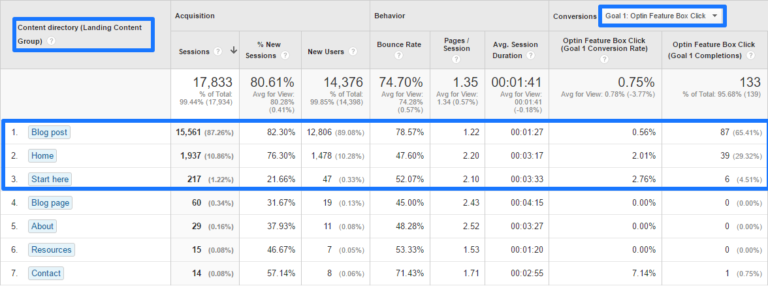
A few things to conclude here:
- The evaluated goal is on “Option Feature Box Clicks”.
- Almost 90% of the traffic lands on a blog post.
- In absolute numbers, the blog posts are responsible for 2/3 of all conversions.
- The “homepage” and “start here” page convert really well.
- The “homepage” converts three times above average if compared to its traffic percentage.
- In short, you can get a very quick overview of how your landing content groups actually perform.
3. Navigation Summary
The Navigation Summary report can be hard to read if you have hundreds or maybe even thousands of pages on your website. Applying content groupings can be really effective if you want to know how people navigate through different sections on your website. On default the content is ungrouped in this report:
- Step 1: Change Group pages by to the name of your content grouping.
- Step 2: Change Current Selection to one of your content groups, e.g. Blog Post.
This is great information. A few insights on this blog: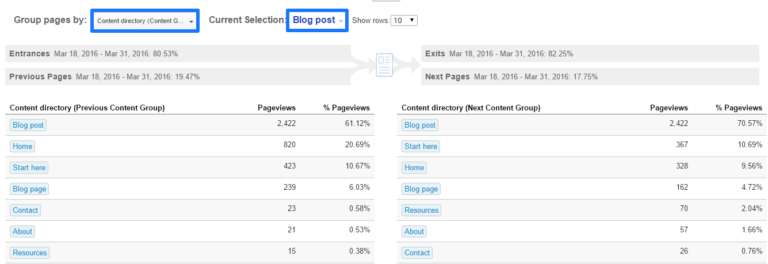
- More than 80% of the visitors leave the website on a blog post.
- 7 out of 10 people that view another page go to a blog post.
- 10% continues to the “start here” or “home” page.
- The “resources” page, where a lot of affiliate links are embedded, gets 2% of all clicks of people that continue their journey.
- These quick insights are impossible to get from the default settings.
4. Behaviour Flow
The Behavior Flow report isn’t my number one report, but it can be useful in some cases. It visualises the path users take when navigating from one page or Event to the next. This report can help you discover what content keeps users engaged with your site and can also help identify potential content issues.
Navigate to Behaviour >> Behaviour Flow.
To find this report:
- Navigate to Behavior Flow.
- Select the Content directory Content Grouping.
- Change the dimension to Default Channel Grouping.
- Select Organic Search.
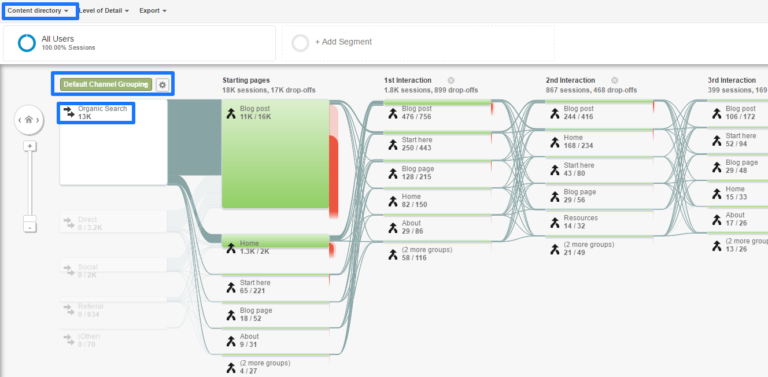 This report helps to analyse how people enter your site via organic search and then navigate from one section to the other and where they drop off. You can report this process per channel to see how visitors from each channel perform.
5. Events
There is one last report I want to share with you. It’s the Event Pages report. Most people view their events in relation to a particular page. However, it is also possible to view your events in relation to specific content sections on your website. Event reports are great for eCommerce sites who would want to compare which categories see the highest rates of click through to check out
Note! You will need to have event tracking set up prior to accessing this report.
To find this report:
- Navigate to Events >> Pages.
- Select a Content Grouping.
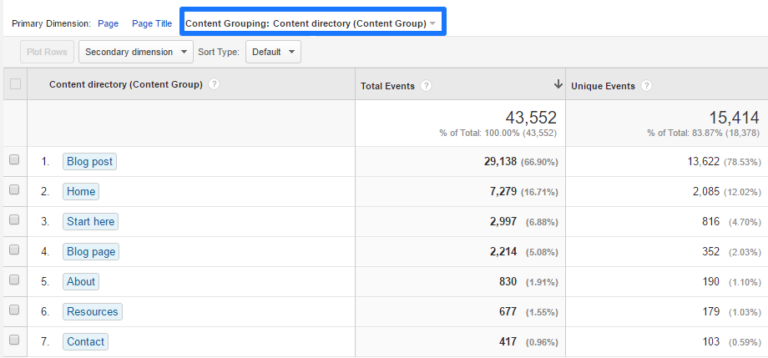
By using secondary dimensions and table filters you can further drill down on your event data to make it more actionable.
Group therapy for your site
Now that you're ready to source the data for your site's Content Groupings I hope it awakens your creativity to work with Content Groupings in Google Analytics. If you have any creative applications for Content Groupings, let us know in the comments section below.
Contact us
If you want to know more about Google Analytics don’t be shy we’re happy to assist. Simply contact us here
You might also like
In-House Vs Outsourcing: What's the Right Fit for Your Business?
08 July 2026
Posted by Jon Glavinas in Talent Agents
Navigate the in-house vs outsourcing dilemma. Find the ideal approach for your business to enhance efficiency, control, and adaptability for future g...
Read more
Where Wonder Man Fits Into The Marvel TV Universe
27 June 2026
Posted by Che Kohler in Geek Chic
Wonder Man is a character-driven miniseries and superhero satire about Simon Williams, a struggling actor with accidental superpowers in Los Angeles
Read more{{comment.sUserName}}
{{comment.iDayLastEdit}} day ago
{{comment.iDayLastEdit}} days ago