 News Home
 {{blogcategory.sCategoryName}}
Recent posts
Money Talks
What South Africa's Latest Financial Pressure Data Tells Us About Household Debt
16 September 2026

nichemarket Advice
What Are Cookieless Pings?
12 September 2026

Money Talks
What Zero Commission Means for DXY Traders on Exness Pro Account
10 September 2026

Constructive Criticism
How to Read a Tar Surfacing Quote (So You Don't Overpay)
31 August 2026
Popular posts
Extravaganza
Trending Music Hashtags To Get Your Posts Noticed
24 August 2018
Geek Chic
How To Fix iPhone/iPad Only Charging In Certain Positions
05 July 2020
Extravaganza
Trending Wedding Hashtags To Get Your Posts Noticed
18 September 2018
Money Talks
How To Find Coupons & Vouchers Online In South Africa
28 March 2019
What South Africa's Latest Financial Pressure Data Tells Us About Household Debt
16 September 2026 | 0 comments | Posted by Rowan Breeds in Money Talks
The national debt statistics say South African households are coping. The households that walk into a debt counsellor's office say something else. A monthly index built from their applications puts a number on the gap.
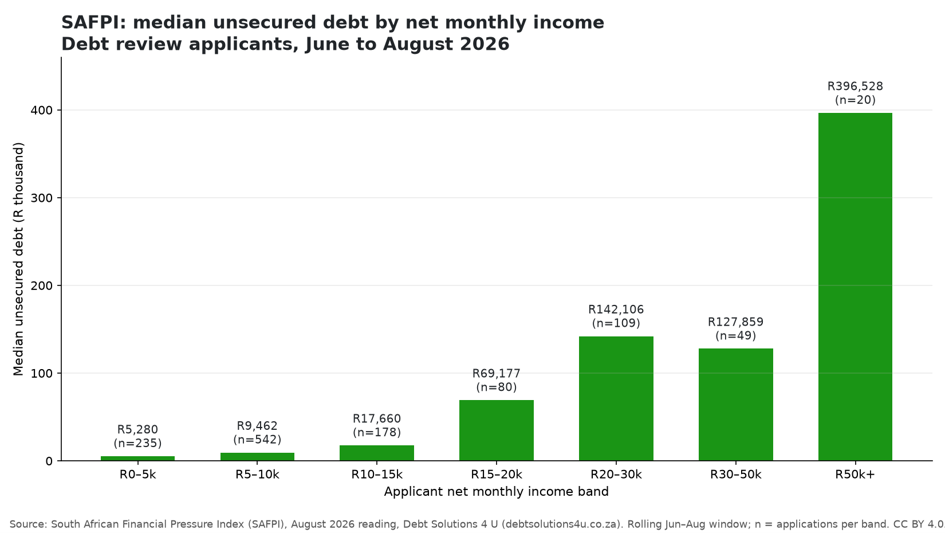
Chart: South African Financial Pressure Index (SAFPI), Debt Solutions 4 U, August 2026. Original work, CC BY 4.0. Source data[1]
On paper, South African households are managing. The Reserve Bank puts household debt at 62.2% of disposable income in the first quarter of 2026, with debt-service costs at 8.4% of income [2]. Of the 104 million credit accounts on file at the bureaus, eight in ten are in good standing [3]. Headline inflation eased to 4.3% in July [4].
Those figures describe the whole country, and for most of the country they are true. They do not describe the household at the bottom of the distribution, which is the household our practice meets every day. Since December 2025, Debt Solutions 4 U has published aggregate figures from its own debt review applications and credit-bureau records as the South African Financial Pressure Index (SAFPI). Before quoting a single number, I want to be clear about what it is.
What SAFPI measures, and what it does not
SAFPI measures financial pressure among people who have already asked a debt counsellor for help. It reads how deep the difficulty is among people in difficulty. It is not a national average. Any headline that says "South Africans hand over 58% of their pay to debt" is misreading it, and we say so on the index page itself.
Two more caveats. The repayment side of every ratio comes from account-level credit bureau data; the income side is declared by the applicant. One half is verified, the other is stated. And SAFPI publishes medians, not averages, because a handful of very large debts drag an average away from any real person. Every figure carries the sample size it came from, and any group under ten records is reported as a count, never a percentage. The full method, definitions and every table below are on the SAFPI page [1], and the data is released under a Creative Commons licence so anyone can check it.
The headline number: 58.4%
In the rolling June to August 2026 window, the median applicant was committing 58.4% of net monthly income to debt repayments before rent, transport or food, across 1,174 applications with complete figures. More than half of applicants, 56%, were above the 50% line. August was the busiest month in the series, with 604 applications (SAFPI, August 2026 reading [1]).
Put the Reserve Bank's 8.4% debt-service ratio next to SAFPI's 58.4% and the shape of the problem is clear. The national figure is a mild fever. The applicant figure is a household in the emergency room. Both are true at the same time, and the space between them is where most personal-finance reporting goes quiet.
The month-to-month series is noisy, and SAFPI says so. The reading was 61.4% in January on 103 applications, 50.1% in April on 246, 61.7% in June and 59.4% in August on 604. Small monthly samples swing. The rolling three-month figure is the one to quote.
Debt scales with income
The most useful table in SAFPI splits applicants by earnings.
| Net monthly income | Applications | Median unsecured debt | Median monthly repayments | Median left after debt and essentials |
| R0 to R5,000 | 253 | R5,280 | R1,986 | R1,080 |
| R5,000 to R10,000 | 542 | R9,462 | R4,051 | R3,399 |
| R10,000 to R15,000 | 178 | R17,660 | R7,539 | R5,530 |
| R15,000 to R20,000 | 80 | R69,177 | R10,838 | R8,272 |
| R20,000 to R30,000 | 109 | R142,106 | R12,227 | R11,321 |
| R30,000 to R50,000 | 49 | R127,859 | R19,257 | R16,876 |
| R50,000 and above | 20 | R396,528 | R31,481 | R32,729 |
Source: SAFPI, August 2026 reading [1], Debt Solutions 4 U. Rolling June to August window; sample sizes shown per band. Bands under 50 applications are indicative only.
Read it top to bottom and the pattern repeats at every step. Someone earning between R5,000 and R10,000 a month typically owes R9,462 in unsecured debt. Someone earning between R20,000 and R30,000 owes R142,106, about fifteen times as much on roughly three times the income. A good salary is not protection. Credit providers lend against what you earn, so earning more means qualifying for more, and each loan passes its affordability test on the day it is granted. Nobody in the chain sees the whole balance sheet. The consumer is usually the last to add it up.
The R50,000-plus band rests on only 20 applications. Treat it as an indication, not a firm figure. SAFPI would rather publish it with the sample size showing than leave it out.
It is the personal loans
Split the 5,842 unsecured accounts in the window by type and one category dominates. Personal loans are 3,683 of the accounts and R51.66 million of the R79.02 million owed, 65.4% of every rand. Credit cards are next at 21.4%. Store cards, the account type most people worry about, are numerous but small: 627 accounts carrying 4.6% of the balance (SAFPI, August 2026 reading [1]).
The national data hints at the same thing. The NCR's most recent Credit Bureau Monitor shows 14.6% of all accounts three or more instalments behind [3]. In our applicants' files, the account that tips a budget over is rarely a clothing account or a cellphone contract. It is a personal loan, very often one taken to pay other debt. Rolling several debts into one bigger loan changes the shape of the problem without changing its size.
Half the people asking for help do not know where they stand
One SAFPI finding surprised us more than any ratio. Before an applicant's status is checked against the National Credit Regulator's debt review register, we ask whether they believe they are under debt review. Of 786 people who answered in the June to August window, 403, or 51.3%, said they were not sure. Where a stated belief could be tested against the register, one in four had it wrong. In the SAFPI baseline sample of 524 register checks, 44.1% of people were already actively listed while approaching a counsellor for a new application (SAFPI, status findings [1]).
That is not a statistic about debt. It is a statistic about information. A consumer can only be under debt review with one counsellor at a time. The right route for someone already listed is a transfer, a clearance certificate or a court application, not a fresh application. Anyone who signs a consumer up without checking the register first is not doing the job.
What an ordinary household should take from this
Three things, none of which require a debt counsellor.
Know your ratio. Add up every unsecured repayment and divide by your net pay. Above 40% is a warning. Above 50% is where the median SAFPI applicant lives.
Watch the personal loan, not the store card. If a loan is servicing other credit, the budget has already failed and the loan is postponing the moment you find out.
Check the register. If you have ever started a debt review application, even one you abandoned years ago, confirm your status with the NCR before you apply for anything.
The country's averages will keep saying that household finances are under control, and for most households they are. SAFPI exists to describe the ones for which they are not, with the sample sizes shown, so that the number is read for exactly what it is.
About The Author
Rowan Breeds is an NCR-registered debt counsellor (NCRDC2423) and a Director of Debt Solutions 4 U, a DCASA member practice in Centurion, Gauteng. He holds a BCom in Finance from UNISA and has worked in debt collection and debt counselling for more than a decade. The South African Financial Pressure Index (SAFPI) is published monthly by the practice at debtsolutions4u.co.za. Contact: rowan@debtsolutions4u.co.za, +27 82 745 6778.
Sources:
- The South African Financial Pressure Index (SAFPI), August 2026, https://www.debtsolutions4u.co.za/.
- SARB Quarterly Bulletin, summarised by Nedbank Economics, May 2026, https://www.nedbank.co.za/
- NCR Credit Bureau Monitor, Q2 2025, https://www.ncr.org.za
- Stats SA, July 2026 CPI, https://www.statssa.gov.za
Tell us your story
Got a story worth sharing? Find out how to submit a guest post, and when you're ready, get in touch with us.
Looking to promote your business?
Businesses can create a free business listing on nichemarket. The more information you provide, the easier it is for customers to find you online.
Getting started is simple. Head to our sign-up form and follow the prompts, and you can be listed in our Finance category. For a more detailed walkthrough, check out these guides:
Recommended Reading:
If you enjoyed this post and have a little extra time, why not dive into more articles on Finance and Debt Management?
- How To Leverage Commercial Loans For Your Business
- How To Clear Your Name After Being Blacklisted
- Effective Tips for Debt Settlement and the Importance of Bankruptcy Filing
- How To Select Auto loans and How To Buy a Vehicle When in Debt
Tags: south africa, household debt, debt review, personal loans debt, financial pressure index
You might also like

How to Read a Tiling Quote in South Africa (And Spot What's Quietly Inflating It)
25 August 2026
Posted by Frank N in Constructive Criticism
Learn what a proper tiling quote should include, five red flags to watch for, and how to spot padding before you sign in under a minute.
Read moreWhat Zero Commission Means for DXY Traders on Exness Pro Account
10 September 2026
Posted by Joana Borges in Money Talks
Zero commission on the Exness Pro Account means you pay no extra per-lot fee when you open or close a DXY (US Dollar Index) trade. Here is how it wor...
Read more
{{comment.sUserName}}
{{comment.iDayLastEdit}} day ago
{{comment.iDayLastEdit}} days ago